
Produces diagnostic plots comparing fitted values against actual (true)
response values for a fitted nn_fit model.
Regression (single output): returns a named list with two panels – residuals vs fitted and actual vs fitted.
Regression (multi-output): returns a named list with one actual vs fitted panel per output column.
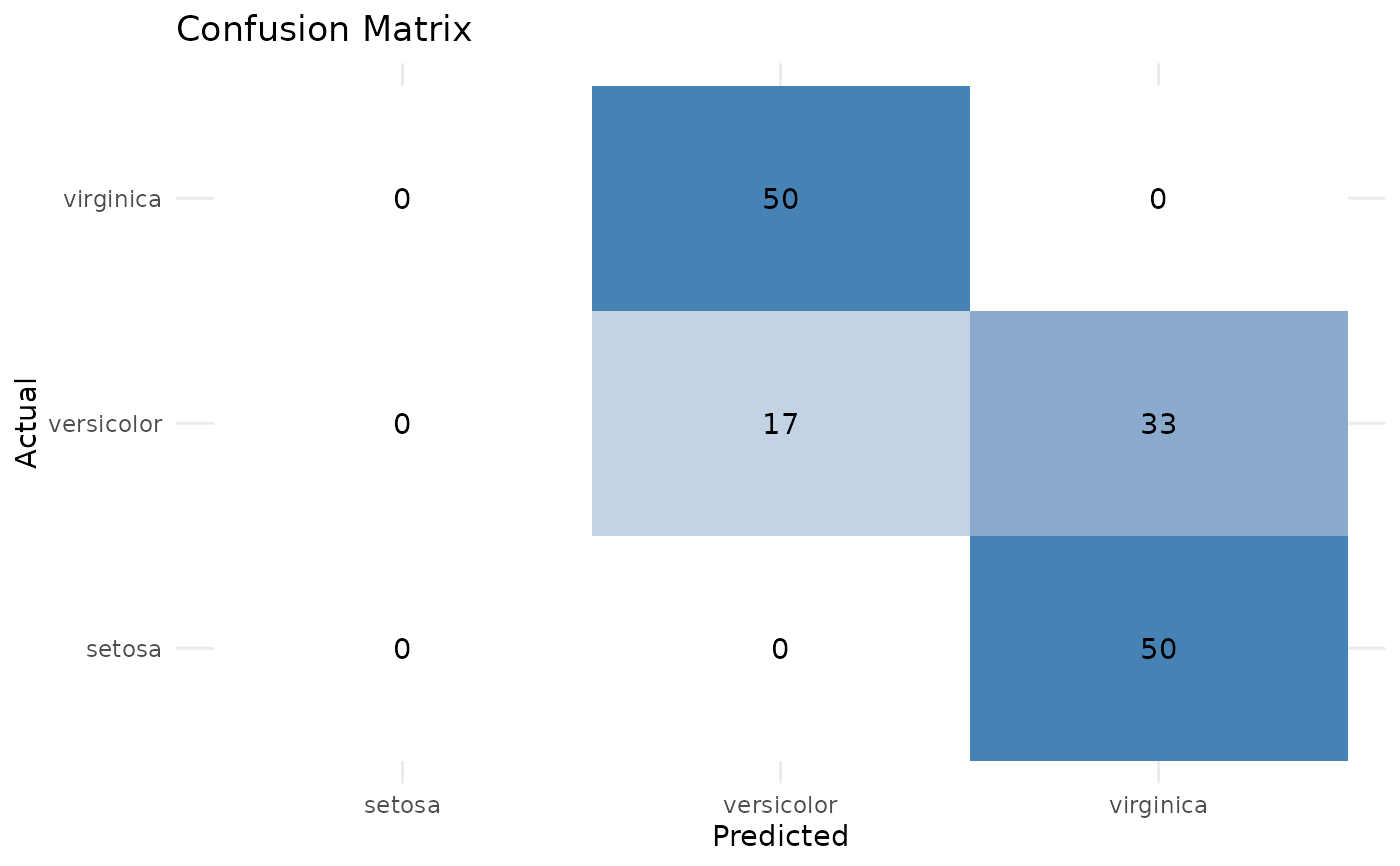
Classification: returns a single confusion matrix heatmap.
Arguments
- object
A fitted model of class
nn_fit, as returned bytrain_nn(),ffnn(), orrnn().- actual
A vector of true response values, the same length as the training data used to fit
object.- ...
Additional arguments (currently unused).
Value
For regression, a named list of ggplot2::ggplot() objects (one per
diagnostic panel). For classification, a single ggplot2::ggplot()
confusion matrix heatmap.
Examples
# \donttest{
if (torch::torch_is_installed()) {
# Regression
m = train_nn(
as.matrix(iris[, 2:4]), iris$Sepal.Length,
epochs = 5
)
autoplot_diagnostics(m, actual = iris$Sepal.Length)
# Classification
m_cls = train_nn(
as.matrix(iris[, 1:4]), iris$Species,
epochs = 5
)
autoplot_diagnostics(m_cls, actual = iris$Species)
}
#> Returning two plots. Install patchwork and use `p[[1]] + p[[2]]` to combine
#> them.
 # }
# }